Currently migrating my blog from wordpress and other scattered sources.
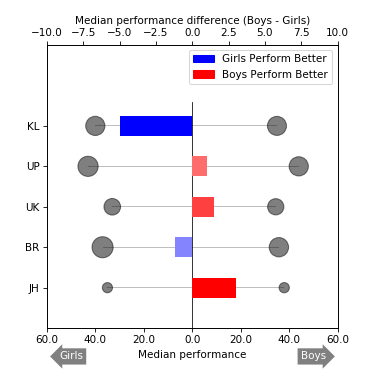
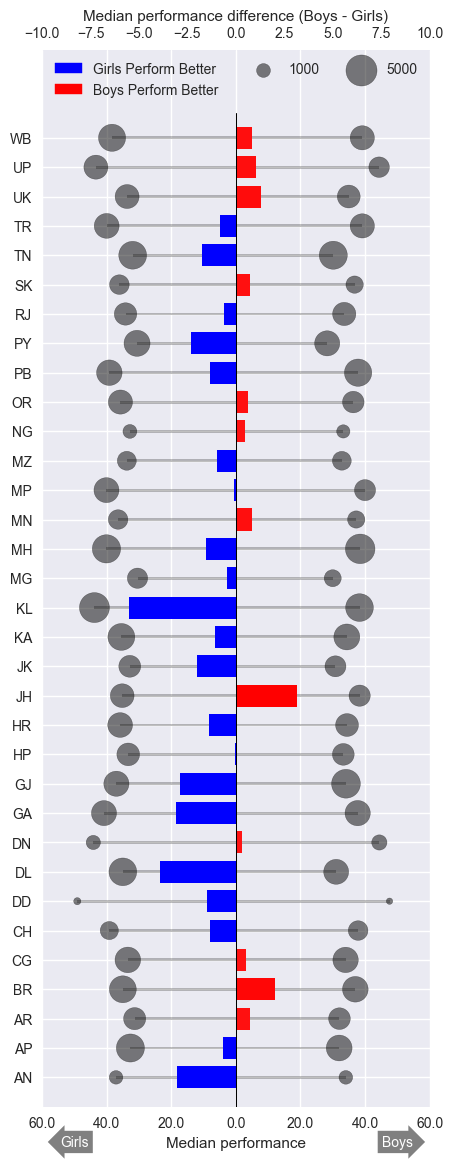
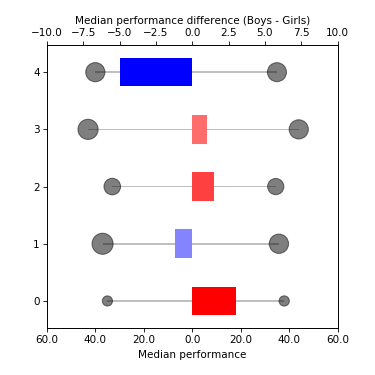
In this post I will describe how to create a chart with data encoded as glyphs and color from scratch. The chart below explains the gender difference in school performance in different states of India.
h_per =
| State | Boy | Boy_count | Girl | Girl_count | diff | Boys_better |
|---|---|---|---|---|---|---|
| JH | 38.0 | 971 | 35.0 | 956 | 3.0 | True |
| BR | 35.8 | 3550 | 37.0 | 4093 | -1.2 | False |
| UK | 34.5 | 2438 | 33.0 | 2543 | 1.5 | True |
| UP | 44.0 | 3407 | 43.0 | 3757 | 1.0 | True |
| KL | 35.0 | 3346 | 40.0 | 3401 | -5.0 | False |
Our aim is to encode data into
- line : median values of boys and girls
- colorbar : difference in median
- circle size : count
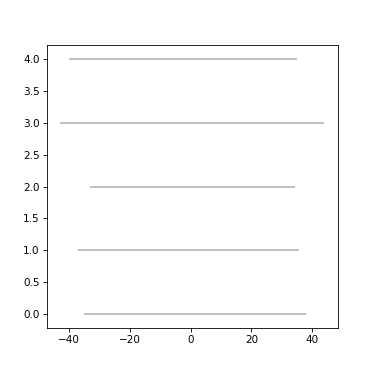
Step 1
Plot lines on first axis ax.
fig, ax = plt.subplots(figsize = (5,5), dpi=75)

ax.barh(h_per.index ,width=h_per["Boy"], height=0.03, color="k", align="center", alpha =0.25, linewidth = 0)
ax.barh(h_per.index, width=-h_per["Girl"], height=0.03, color="k",align="center", alpha =0.25, linewidth = 0)
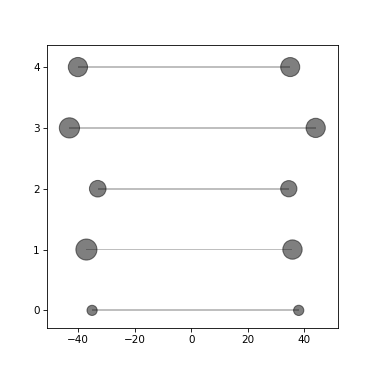
Step 2
Add scatter plot on to ax with marker size mapped on to count.
ax.scatter(x=h_per["Boy"], y=h_per.index, s=h_per["Boy_count"]*0.1, color="k", alpha=0.5)
ax.scatter(x=-h_per["Girl"], y=h_per.index, s=h_per["Girl_count"]*0.1, color = "k", alpha =0.5)

ax.set_xlim(-60, 60)
ax.set_xticklabels([str(abs(x)) for x in ax.get_xticks()]) # changing the x ticks to remove "-"
ax.set_xlabel("Median performance")
Step 3
Twin the axis ax to have an additional barchart on the same. This blog explains how to create _COLORS.
ax2 = ax.twiny()
ax2.barh(h_per.index, width=h_per["diff"], height=0.5, align="center", color=_COLORS)
ax2.set_xlim(-10, 10)
ax2.grid(False)
ax2.set_xlabel("Median performance difference (Boys - Girls)")
Step 4
Final touch; place legends, patches and labels on appropriate places.
# y-axis labels
ax.set_ylim(-1, len(h_per.index)+1)
ax.set_yticks(h_per.index)
ax.set_yticklabels(h_per['State'])
ax.axvline(x= 0, color='k', linewidth = 0.75, ymax = 0.8)

# legend
red_patch = mpatches.Patch(color='red', label='Boys Perform Better')
blue_patch = mpatches.Patch(color='blue', label='Girls Perform Better')
ax.legend(handles=[blue_patch, red_patch], loc=1, ncol=1)

# annotation patch
tboy = ax.text(50, -1.7, "Boys", ha="center", va="center",
               rotation=0, size=10,color = "w",
               bbox={"boxstyle":"rarrow,pad=0.3", "fc":"grey", "ec":"b", "lw":0})
tgirl = ax.text(-50, -1.7, "Girls", ha="center", va="center",
                rotation=0, size=10,color = "w",
                bbox={"boxstyle":"larrow,pad=0.3", "fc":"grey", "ec":"b", "lw":0})

fig.savefig('3.png', dpi=75)