Currently migrating my blog from wordpress and other scattered sources.
Creating a filled barchart with matplotlib
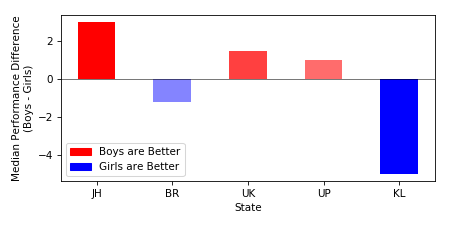
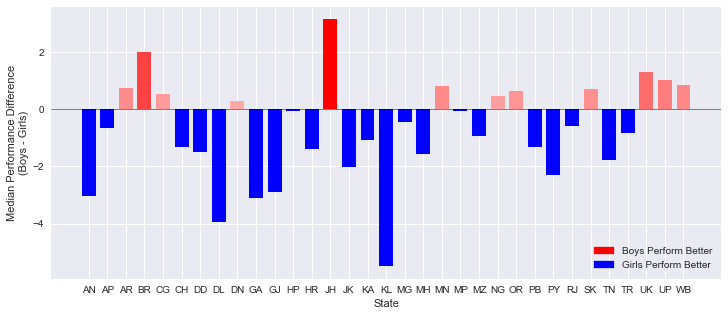
It’s fairly common to encode a variable with color intensity like below. Here bar color reflects its magnitude. This post will take your step-by-step on how to create one like below.
Lets make a filled bar chart with the pandas.dataframe below. Our aim is to map the diff column to color values.
d_per =
| State | Boy | Girl | diff | Boys_better |
|---|---|---|---|---|
| JH | 38.0 | 35.0 | 3.0 | True |
| BR | 35.8 | 37.0 | -1.2 | False |
| UK | 34.5 | 33.0 | 1.5 | True |
| UP | 44.0 | 43.0 | 1.0 | True |
| KL | 40 | 35 | -5.0 | False |
Step:1 Imports and Data
import matplotlib
import matplotlib.pyplot as plt
from matplotlib import mpatches, colors
import pandas as pd

d_per = \
pd.DataFrame({
    'State':['JH','BR','UK','UP','KL'],
    'Boy': [38,35.8,34.5,44,35],
    'Girl': [35,37,33,43,40],
})
d_per['diff'] = d_per['Boy'] - d_per['Girl']
d_per['Boys_better'] = d_per['diff']>0
Step:2 Map data to color
Define _COLORS which maps color-column to corresponding rgb values using matplotlib.cm.ScalarMappable(norm, cmap). It comes with two paramerters norm (decides color spacing) and cmap (color maps used). Some popular functions for norm are listed below and more on colormaps can be found here. Each of these norms comes with their own parameters which you can experiment.
matplotlib.colors.Normalizematplotlib.colors.LogNormmatplotlib.colors.PowerNormmatplotlib.colors.SymLogNorm
The colors are generated by calling to_rgba() with the data to encode as _COLORS = cc_.to_rgba(d_per["diff"]).
cc_ = matplotlib.cm.ScalarMappable(norm=colors.SymLogNorm(), cmap='bwr')

_COLORS = cc_.to_rgba(d_per["diff"])

print(_COLORS)

[[1.         0.         0.         1.        ]
 [0.34509804 0.34509804 1.         1.        ]
 [1.         0.16470588 0.16470588 1.        ]
 [1.         0.25882353 0.25882353 1.        ]
 [0.         0.         1.         1.        ]]
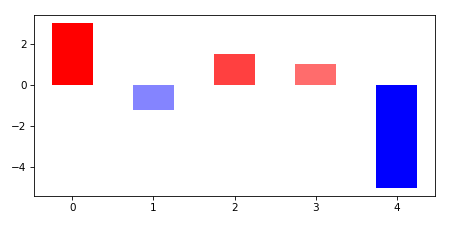
Step:3 Plot the figure
Now that you have the data converted to colors, you can pass it to plot function.
fig, ax = plt.subplots(figsize=(6,3))

ax.bar(np.arange(len(d_per["diff"])),
        height = d_per["diff"],
        width = 0.5,
        align = "center",
        color=_COLORS)
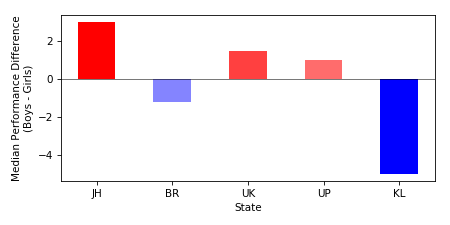
Set ticks and labels
ax.set_xticks(d_per.index)
ax.set_xticklabels(d_per['State'].tolist())
ax.set_xlabel("State")
ax.set_ylabel("Median Performance Difference\n(Boys - Girls)")

# add think line for seperation
ax.axhline(0, color='k', linewidth = 0.5)
Step:3a Create legend patches
Finally add some patches
red_patch = mpatches.Patch(color='red', label='Boys are Better')
blue_patch = mpatches.Patch(color='blue', label='Girls are Better')
plt.legend(handles=[red_patch, blue_patch], loc=3)