Introduction
This is a project based on a use case of Gramener, a data science company. The aim is to identify the trends in 8th grade student performance based on National Achievement Survey by NCERT.
About this report
This is a distilled version of analysis with the most significant insights about data. The orignial version with codes used to generate graphs can be found here
Questions
We have attempted to answer three most pertaining questions below.
- What influences students performance the most?
- How do boys and girls perform across states?
- Do students from South Indian states really excel at Math and Science?
What influences students performance the most?
We performed a feature selection based on SelectKBest to evaluate the relative importance of features. To quatify the overall student performance, we included an additional feature ‘performance’ = average of (‘Maths %’, ‘Reading %’, ‘Science %’, ‘Social %’).
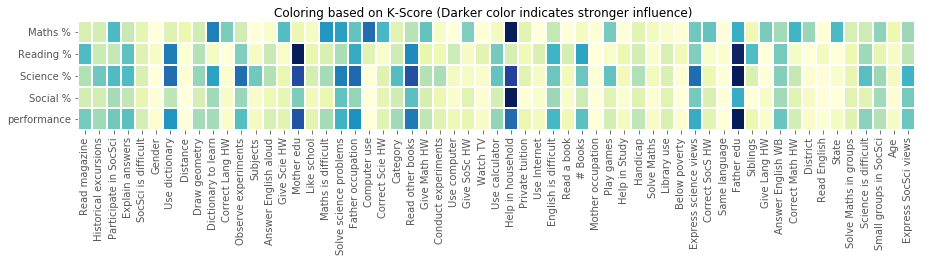
The education of parents and whether they help in household were decisive in predicting a student’s performance.
The heat map sumamrize the scores obtained for each feature based on different target variable: Reading, Science, Social, Maths and Overall performance with prominent features shaded in darker color.
| Parameter | Best Feature |
|---|---|
| Overall Performance | ‘Father edu’ |
| Maths | ‘Help in household’ |
| Reading | ‘Mother edu’ |
| Science | ‘Father edu’ |
| Social | ‘Help in household’ |
Some interesting observations about features
- Certain features are influential in the performance of certain subjects alone:
- Siblings -> Reading %
- Computer Use -> Math %
- Subjects -> Science %
- Give Language Hw <-> Math %
- State -> Math %
- Correct Math HW -> Math %
- Correct Sci HW -> Math %
- Features given below consistently stands out across all subjects considered and can be considered as good predictors.
- Father edu
- Mother edu
- Read other books
- help in HouseholdFather occupation
- Express science views
- Express SocSci views
- Solve science problems
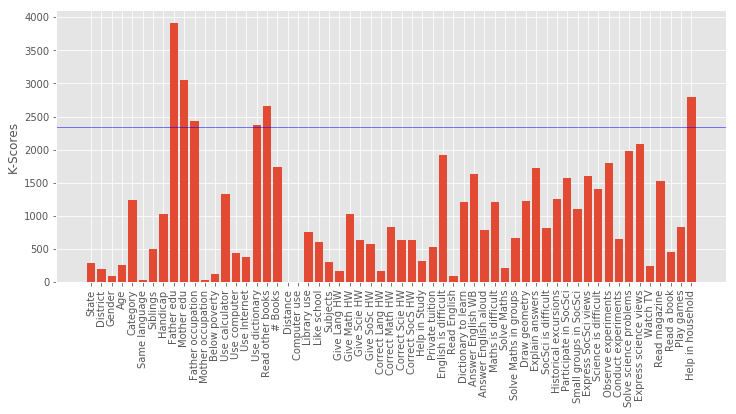
Factors influencing average performance
Here we describe the process by which we calculated the scores for performance. A simillar treatment is used fto calculate scores for ‘Maths %’, ‘Reading %’, ‘Science %’,and ‘Social %’.
Among top features, ‘Father edu’ has distinctly high score for performance, almost 30% higher than nearest second.
count    180774.000000
mean         38.095342
std          14.949624
min           0.000000
25%          27.035000
50%          35.640000
75%          47.320000
max         100.000000
Name: performance, dtype: float64
======	Target Variable	: performance ======
Best 5 Features:
 [('Father edu', 3906.8744966773766),
 ('Mother edu', 3052.1893687615902),
 ('Help in household', 2793.8799410412198),
 ('Read other books', 2661.1779134014673),
 ('Father occupation', 2428.0365114374408)]
Since father education has the highest score, we decided to plot the performance w.r.t ‘Father edu’ to explicitly see the influence. The plot shows an upward trend in the median performance %.
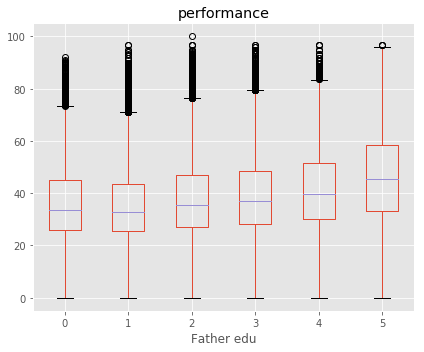
Legend
        Column                    Name Level          Rename
24  Father edu        Degree and above     5  Degree & above
25  Father edu              Illiterate     1      Illiterate
26  Father edu          Not applicable     0  Not applicable
27  Father edu           Primary level     2         Primary
28  Father edu         Secondary level     3       Secondary
29  Father edu  Senior secondary level     4    Sr secondary
How do boys and girls perform across states?
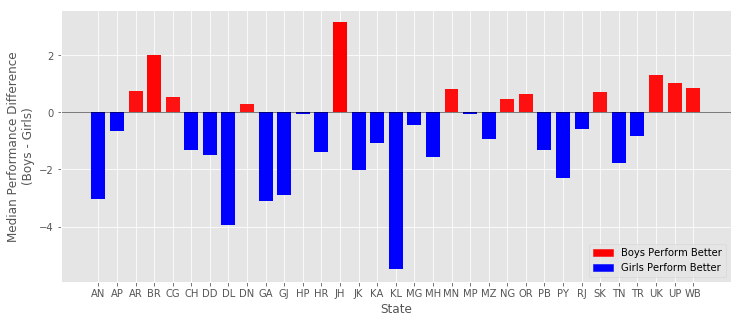
Across most states, Girls tend to have a higher median performance than boys.
Some states with notable exception to this rule are Jharkand (JH) and Bihar (BH). Since these state have high gender inequality, this trend could be due to lack of access to educational resources to girls. To confirm, it has to be cross-checked with data pertaining to accesibility of girl’s eductaion in these states.
Of the states where girls perform better, Kerala and Delhi stands out. Both states showed that median % of girls is almost 4% better than boys.
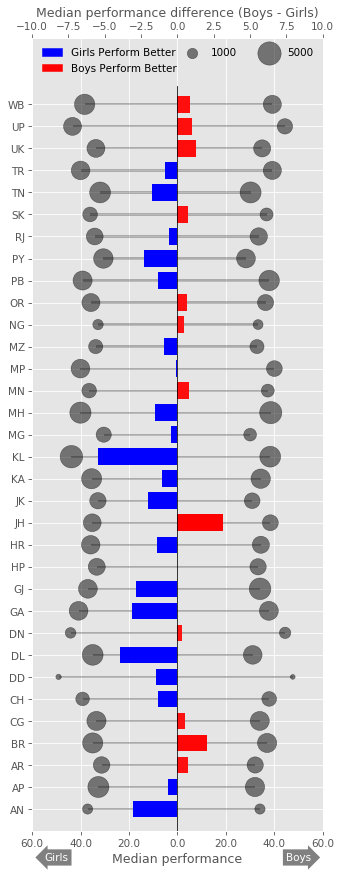
Although vary considerably across states, the sample size remained the same for boys and girls within each state. This further affirms our conclusions based on gender difference.
The figure shown above sumamrizes the data based on gender difference. We used two axes for representing data for each state (1) Actual median performance on bottom (2) Difference in the median between boys and girls on top. The length of lines (from 0 at the center) represent median values while size of circles maps to sample size. The bar graph indicates difference with blue favouring girls and red favouring boys.
Do students from South Indian states really excel at Math and Science?
Students from rest of the country tends to perform marginally better than South Indian students
To determine this, we considered southern states as : “Andhra Pradesh”, “Kerala”, “Karnataka” and “Tamil Nadu”. Meanwhile other states are referred to as “the rest of country”. The performance score for ‘Science and Math’ is defined as the mean value of both ‘Science’ and ‘Math’.
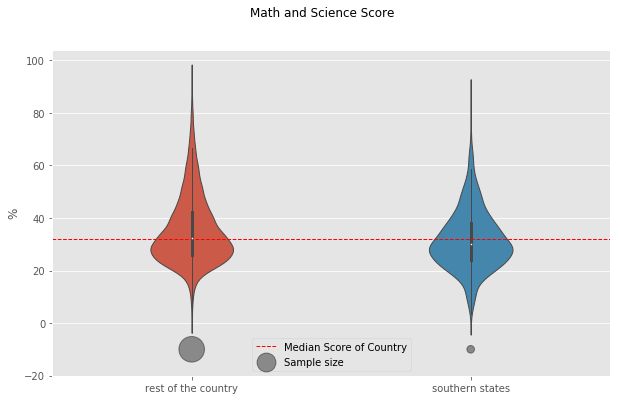
Both southern states and the rest of the country followed a simillar distribution even though the sample size was different.
We found that central tendendencies of Southern States to be slightly lower than the rest of country. But it should be noted that number of samples in the Southern States is far less. Overall, south indian states perform worse compared to the rest of country. These consclusions are based on unequal sample sizes as indicated by the circles below each violin plot.
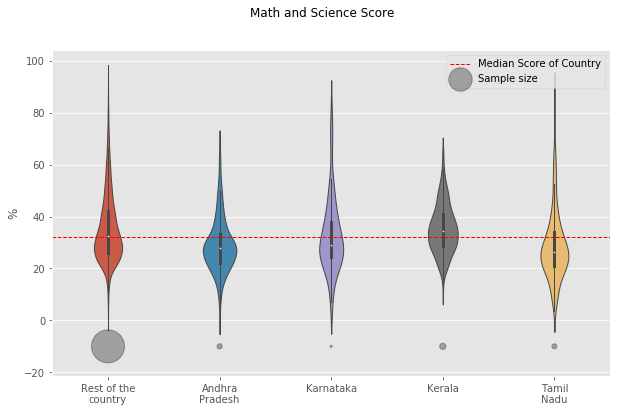
Kerala was an exception among southern states with higher median score than other southern states as well as the rest of the country.
To identify if all southern states follow this pattern, we split the data into corresponding southern state and found that “Kerala” as an exception to the trend. “Kerala” tends to have higher median score than other southern states, rest of the country and the overall median of country. Although “Kerala” has a higher median, the distribution is narrower compared to other states.
Sample size from Karnataka was small compared to other southern states but showed a wider distribution. Among southern states, “Tamil Nadu” followed the trend of rest of the country with longer tails but with a lower median score than all others.